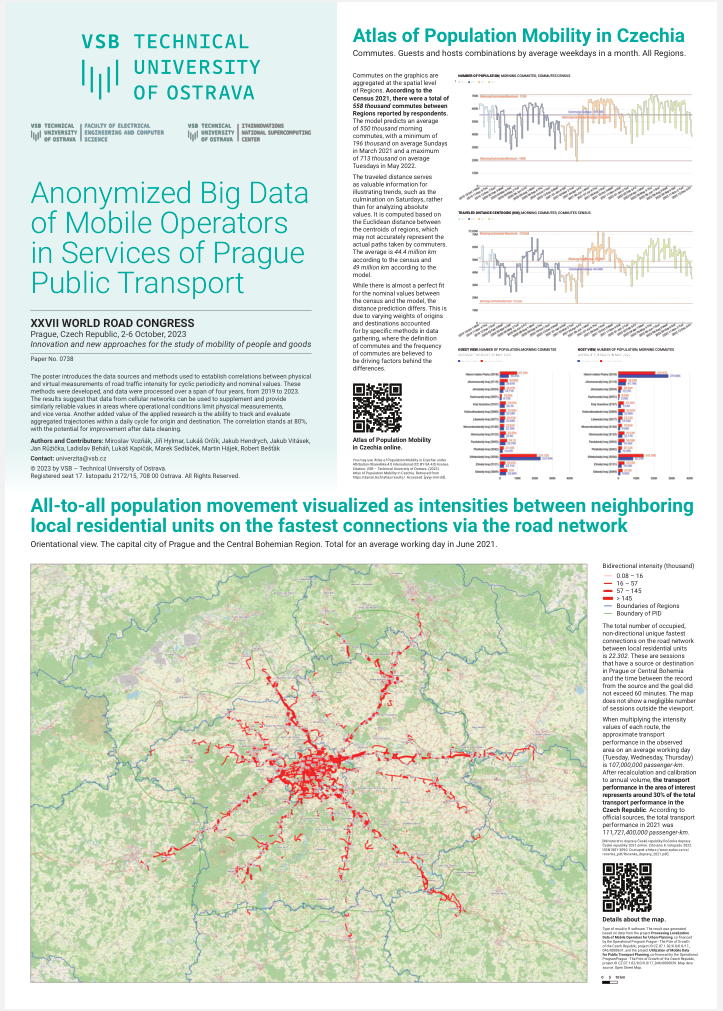
Anonymized Big Data of Mobile Operators in Services of Prague Public Transport
Conference Proceedings
The original text is available in the proceedings of the conference1. Registration for a download needed.
Conference Poster
Introduction
The paper is based on practical experience gained within the project "Use of mobile data for planning public transport" 2, which was conducted between 2020 and 2022. The project was focused on big data analytic of location and operational data in public cellular networks and is referred in this text as "ROPID". The spatial and temporal data in mobile networks provides an important information about movements in territory. First, all records had been anonymized before were processed. Results are presented in the aggregated form as counts of residents, commuters and riding out users in the selected territory. The overall view provides detailed information concerning a granularity at the level of residential units and time span.
The innovation of the approach consists in the possibility to monitor movements and to better estimate the number of residents present on a particular territory. The traditional approach only applied the balance principle, it monitored the usual residents and aimed at estimating the number of people who left the territory and who arrived at the territory for a particular reason. Using location and operational data of cellular networks enables to easily estimate the number of people present without knowing any other factors. The main goal of our research was to provide information on occupancy of selected routes based on aggregated and evaluated data of mobile operators.
The volume of information and data is growing geometrically, one of the important sources is hidden in operational records of public cellular networks. Any activity of mobile phone generates a record containing a piece of spatial and temporal information which is stored in databases of mobile operators for a particular period. The information regarding a position is not precise enough to perfectly trace movements but can be generalized and provide important statistic data on the movement of population in an observed territory. The paper describes the innovative use of mobile data for planning public transport in Prague and shares a unique gained experience.
The timeline of the processed data is 30 months, and although the delivered results were limited to two NU3 level regions (Prague and Middle Bohemia), the computation of data was done for the entire Czech Republic to obtain control values and sums, which were not only requested by customers but were also necessary to ensure the consistency and validity of the results. Throughout the project period, we worked with all records registered in homeland networks. Two of the major three mobile operators with a market share of over 70% participated in the project with data. Two techniques were used to consolidate the results. Namely additions of data from both networks and single network data where the other network has a verification role. Data presented originate from the second method.
Data from the mobile network can be used for different tasks. It is a matter of processing methods that determine the final use. Some methods and resulting variables may be used in transport planning and in another processing method for tasks related to regional planning. The project "ROPID" is the major data source discussed in the paper. It shall be completed, that our team was working on another project "Processing of location data of mobile operators for city planning" 3, in parallel. These projects had partially overlapped. It was challenging for the team, but synergic opportunities arise at the same time. To name one, we had the possibility to utilize source data across both projects resulting in greater data timeline availability.
The output, we delivered for "ROPID" was 49 datasets consolidated into 83 unique tables and views. The total number of records in the registered tables is 103.7 billion, with a size of approximately 2 TB. These records have 616 unique attributes combined from 281 descriptive keys and values, such as timestamps, days, weeks, regions, classified observations, etc. Most of the resulting data is available on request under an open license.
From the results, we have selected a single variable for the purpose of this report. This variable can be compared with well-established methods of traffic intensity measurements, built into road detectors. The variable in question is "All to all commuting matrix cellular network intensity".
Comparison of an independent data sources (a) "built into road detectors" values (b) "All to all commuting matrix cellular network intensity" is the research question discussed in this report.
The "System Generated Report Traffic Intensity Proof of Concept" 4 contains a detailed analysis of our findings, while the "Dataset for Results Validation" 5 serves as the dataset that we used to verify the results. We encourage readers to visit the webpage to which these references are pointing, as the site includes the report, including all tables and figures. Due to page limits set by the publisher of this report, these references are referenced herein in the text only.
Our report primarily focuses on providing contextual insights and sharing our experiences rather than delving into complex data analysis.
Projects related to this research include the following.
Authors of the research "Inferring modes of transportation using mobile phone data" 6 claim to process 2 million devices from the Greater Paris resulting to the model which combines mobile network geolocation with transport network geospatial data, travel survey, census and travel card data and generates time variant road and rail passenger flows for the complete region with up-scale to the total population. "Residency and worker status identification based on mobile device location data" 7 research tempts to identify normal commuters, professional drivers, mobility-for-work workers, and nonworkers/home-based workers based on the spatial–temporal patterns of location sightings and derived trips from MDLD (Mobile device location data) with a calibration against public domain ground truth data. The research shall cover national-level case study in the U.S. based on a commercial MDLD dataset. Authors also address the issue of the lack of ground truth information about the device owners raises concern about the biases and representativeness of the nonprobability MDLD sample, which is according to our experience, is the critical factor to be solved for this type of data. Potentially valuable research direction can be "CT-Mapper: Mapping sparse multimodal cellular trajectories using a multilayer transportation network" 8 which results show options to retrieve the real cell phone user paths despite the sparsity of the observed trace trajectories with unsupervised algorithm. The research was based on a group of volunteer users in Paris and vicinity (France). Generally, according to "A Review of Human Mobility Research Based on Big Data and Its Implication for Smart City Development"9 the applications of "human mobility" research using big data, researchers used the "Mobile Phone" as data source in 39 out of 84 scientific articles indexed by the Science Citation Index Expanded and Social Sciences Citation Index.
We also refer to the previous researches conducted on the topic by our team, especially "Population Mobility Data Retrieval from Cellular Networks and its Use Case in Public Transport" 10, "Population data mobility retrieval at territory of Czechia in pandemic COVID-19 period" 11, "Limits of the use of mobile networks in CZSO statistical surveys" 12, "High-Speed Users' Mobility Prediction Scheme Based on Deep Learning for Small Cell and Femtocell Networks" 13 or "Effects of sampling frequency on node mobility prediction in dynamic networks: A spectral view" 14 which serve as a technical and a methodological base for our research.
To the best of our knowledge, the scope, detail, and combination of resources used in this research differentiates it from current studies by several aspects and provides some useful perspectives to consider in human mobility research using mobile phone based big data. See the chapter [Conclusion].
Methods
The section includes methods used to collect and analyze the data as well as details about the data sources (e.g., mobile operators), sampling methods, and data analysis techniques.
Selection of Tested Variable
The evaluated variable selected from the database is "All to all commuting matrix in daily cycle measured from cellular network with no time spend limit in destination transposed with model to neighboring relations between local residential units". The variable is referred to in the report as "All to all commuting matrix cellular network intensity" and can be compared with proven methods of measuring traffic intensity built into road detectors. It is a matrix based on the standardized (addition of records, selection of records) and aggregated (groups with the same parameters are evaluated) SIM movement vector in space during the daily cycle. The relational matrices of "All to all commuting matrix cellular network intensity" represent the links of pairs of places. From the point of view of the mobile network, the change of the cell of the BTS of the mobile network is monitored. A best service map (mobile network coverage map) is used for the transfer of information from nodes composed of BTSs' cells to the administratively defined territory of the local residential units. This allows working with data at the level of cells of these BTS. For simplicity, it is possible to imagine a mobile network cell as one of the three BTS sectors, where each sector is approximately of the similar area, pointing in different direction, or as the cycle divided into thirds with BTS mast in the center.
Work with data at the cell granularity is especially important in areas where distance between BTS is higher. See "Classification of BTS Based on Inter-site Distance Model" 15. In case only data at the BTS granularity level are available, that is in our opinion a significant limit of data from cellular networks.
The variable is reported as a pair region a (local residential unit "A") and region b (local residential unit "B") after a transposition to administrative territory using Mathematical model of the conversion of observations in the mobile network to a territorial element or a specific territory, see "Methods of Calculations" 16. User occurrences are supplemented and selected from a time point of view, i.e., each user has a daily window of (maximum) 48 occurrences, although the actual number of signaling messages is two to three times higher. This method is crucial to ensure the principle of composition, which allows the values to be added and generalized to the total population. For the selection of representative occurrences in the time window, the "Station selected by geo method" and "Station filled" methods are used, see "Methods of Calculations" 16. The matrix applied to the transport network for comparison with detectors does not distinguish directionality. Bidirectional flow is reported. Therefore, it was necessary to use the data from the detectors in both directions for comparison, see "Pairing of Detectors to Achieve Comparable Base" 17.
Data Collection
The source database represents anonymized records of SIMs in a daily cycle, including the timestamp of the record, mobile cell identification and position, identification of the related base transceiver station (BTS) and its position, the frequency at which the cell operates, and radio access network coverage maps produced on the best service concept.
The data are organized in batches comprising a daily cycle. Coverage maps are updated monthly. Additional data that come into play include an open data registry of land use, as well as data from the statistical office about population (updated annually as a rolling increment based on the most recent census). A daily data batch represents, for a single network, approximately 1 billion records, or 4.5 million SIMs.
Data Processing
The answer to the data quality lies beyond the availability of the trends' knowledge, time series and the ability to process data for the entire mobile network in the Czech Republic. This is a key concept that ensures that the overall system checksums are not affected by other circumstances besides outbound and inbound commuting. Fluctuations consisting of inadequacies in the technical system of sampling, collection, transmission of signalling data can be detected and eliminated at the output thanks to this concept. However, this would not have been possible without the use of HPC (High Performance Computing) services within the National Supercomputing Centre at VSB - Technical University of Ostrava, as the support of the result requires the processing of one billion lines of signalling records and a data volume of 0.25 TB in one day. The processed time series for trend and deviation determination is 48 months.

Legend. The location of the measured area within the context of the Czech Republic.
Black borders: The administrative regions at NU3 level (Regions).
Dark grey: Prague Integrated Transport (PID) outermost borer.
Black crosses: positions of build in road detectors measuring traffic intensity whose data were compared.
Variable: Intervals of "All to all commuting matrix cellular network intensity".
The geo locations of variable values are reaching beyond the expected radii of the Middle Bohemia region, which is defined as the project area and takes maximum 59 minutes (time given by very early record in the measured time window and very last possible record in the consequent time window) to drive to the border can be noticed. We intentionally kept these values in the overview image to emphasize the need to thoroughly evaluate and clean the data before inputting it into the model. Possible causes for these unexpected values include airborne traffic, cars going very high speed or incorrect information about the base transceiver station (BTS) or cell position in coverage maps.
Making Square Peg Fit in Round Hole
The physical infrastructure of roads, administrative regions for executing public governance to which statistics are drawn, and mobile service provision via radio cells originated from physical base transceiver stations (BTS) are different. The major challenge in making information about population movement gained from mobile networks understandable and providing the possibility of interpolation with other data sources is to define methods that bring these components to a common ground.
As the core competence of our team is telecommunications and data processing, we have focused on connecting administrative regions and the mobile network. Granularity refers to the level of detail or resolution at which a particular piece of information or data is presented. In the context of administrative regions, granularity refers to the level of detail at which the region is divided, such as by city, district, or neighborhood. Out of the administrative territory granularities options, see "Overview of Processed Spatial Granularities within ROPID and IPR Projects" 18, we have selected local residential units (LRUs) as the core node network toward which the primary data from the mobile network are reported for this particular task.
There are 25000 LRUs, administrative nodes in the Czech Republic. The number is almost constant over years. For these nodes, we distributed data from 60000 cells of mobile networks. Thus, the number of cells is significant, and the coexistence of different mobile technologies and frequencies on a single BTS must be considered. The number of BTS is around 7000 which gives approximately 1:4 BTS:LRUs ratio.
Unlike LRUs, mobile networks undergo changes as technology develops and mobile operators utilize different frequency plans. In the project, we kept up with these changes thanks to regular updates of best service maps. The uneven distribution of base transceiver stations (BTS) in a territory can affect the precision of measurements. In densely populated areas, a greater number of BTS are required due to the limited availability of radio frequency resources. This results in smaller cell areas, which leads to improved precision of measurements in these areas. On the other hand, this is compensated with increased noise in SIM tracking as a multiple technologies and radio resources which are positioned, from our modeling perspective on different coordinates are used simultaneously to serve increased service demand. This use of multiple technologies and radio resources that are positioned at different coordinates can lead to interference, which can negatively impact SIM tracking accuracy and precision in densely populated areas. "Classification of BTS Based on Inter-site Distance Model" 15 shows the situation in detail.
Putting Pieces of Puzzle Together
The key aspect of the project was that we have approached the system globally. Unlike ad hoc analysis of a particular problem or region, outcomes of the project shall work equally well anywhere in the Czech Republic. It is not an analysis for a single region or a city, we have implemented a sophisticated information system with a tuned workflow.
Step by step to achieve results.
- Aggregation of an origin and destination streams is done in a way that no more than the single record of every SIM from the sample population is included in the single time window.
- The mathematical model is used for converting values aggregated on nodes of the mobile network (cells' level) to administrative territory (local residential units' level). See
Mathematical model of the conversion of observations in the mobile network to a territorial element or a specific territory16. - Up-scale to the total population by the regions' constants estimating market share of the mobile network used.
- Expansion (replication) of a region "A" and region "B" relations masses to and uninterrupted sequence of local residential units representing the fastest road connection. See
Unlinked trips between main station16 which demonstrates additions of an unknown interconnecting nodes for the main stations in daily cycle for inspecting a method in detail. The same is used for region "A", region "B" which are not in case of the selected variable the main stations, but any know station resulting fromMathematical model of the conversion of observations in the mobile network to a territorial element or a specific territoryimplementation. - Addition of the values for the same pair, bidirectional. We do not intentionally distinguish directionally which would add unwanted data noise to the inspected variable due to complex problem of selecting a particular road interconnecting region "A" and region "B". The fastest road is not always the same for "A" > "B" and "B" > "A" to name one of many challenges which this step represents.
- Selection of the correct relation, region "A", region "B" pair, whose values represent well the position of a road detector measurements.
- Compare the selected relation measurement of
"All to all commuting matrix cellular network intensity"with results from detectors.

Legend. Pairing of cellular network data with the detector.
The figure shows components of the project in geo-spatial settings. The use case corresponds to "Pairing of Detectors to Achieve Comparable Base" 17, Situation Code dtr4045.
Variables. A. selected pair of detectors which provide comparative ground truth data. B1. Jažlovice (Ricany - 145530), the first region from the pair. B2. Komerční zóna Jažlovice (Ricany - 327077), the second region from the pair. B. Info box about B1, B2 relation which provides basic data. Every relation has this information available. C. The node of the local residential unit (LRU)network which does not enter analysis of the use case. This demonstrates interconnection of LRUs, this node has 6 adjacent neighbors. E.1, E.2 relate to the technology of Google Earth which was used to analyze and provide essential insight to the geo-spatial context and can also be used to deliver results to end-users.
The example uses situation of the "All to all commuting matrix cellular network intensity" during the day measured from the mobile network transposed by the model to the relationships between adjacent local residential units. The average for the usual working day defined as Tuesday, Wednesday and Thursday in June 2021 is used.
Technologies Used in Projects
As proposed in the introduction, we have implemented new approaches, algorithms, individual components, and tools in a newly developed environment to deliver the results. The right mix of technologies, workflows, and methods enabled us to handle extensive tasks with above-average effectiveness. Our reflection on the outputs of other consortium members, which we were able to observe during the project, compared to the tasks executed and delivered by the university, led us to this conclusion.
The main infrastructure components of our technological mix include:
- An internal, medium-to-heavy instance cluster used to prepare tasks, provide ad hoc or atypical computations, and test and develop algorithms.
- An HPC cluster to handle heavy-duty computations.
- Multiple AWS Cloud accounts, which form the core of results interpretation and delivery to clients. Prominent services include S3 storage, Athena DB, Quicksight, and Amplify.
- Variety of the state-of-the-art tools to facilitate analyses and results. Mkdocs, Google Earth, Postgres DB to name examples reflected in this report.
Results
Presentation of results findings is focused on one of goals, namely, to provide information on occupancy of selected routes based on aggregated and evaluated data of mobile operators.
Values Correlation
A significant correlation (Pearson's method) exists between values from physical and virtual measurements for cyclic periodicity, as well as nominal values. Based on the results, we maintain that data from mobile networks can be used to complement and deliver similarly reliable values where the limits of operating conditions for establishing physical measurements are set. There is also additional value added in terms of the ability to monitor and evaluate aggregated trajectories within the daily cycle for paths' origins and destinations.
There are few data sources with content that can be considered similar enough to face direct comparisons. For example, while in this experiment we get a correlation of values of 80% with the potential of increasing it by 10 percentage points after throughout data cleaning, when comparing other variables from the project, correlation values would be lower. As an example, let us name the situation of the census, the number of inhabitants. Inter quartile range width of the result which would compare the population expected (by census) in regions and some adequate variables average from our datasets which offer values based on day-to-day dynamics, would be higher.
The correlation between comparable but independent data is crucial, as it helps to ensure the accuracy of the results. In this study, the data computation system is interconnected and consistent, meaning that the same data sources are used, and the cleaning and modeling procedures of the core data are standardized across all outputs. This allows us to confidently conclude that for many variables without a direct equivalent, the chances of obtaining accurate values are high.
Correlations of values from the mobile network and values from the detectors were calculated under the condition of using only non-zero and non-empty entries in the monitored period, for both variables. The values listed in Table 1 summarize results which are in detail available in the "System Generated Report Traffic Intensity Proof of Concept" 4.
Table: Values correlation results.
| Situation Name | Region A Region B label | Correlation of data from mobile network and detectors | Number of days evaluated |
|---|---|---|---|
| D5 23.30 km | U rybníků (Beroun - 73067) <-> Levín (Beroun - 80799) | 0.75 | 749 |
| D1 2.76 km | Kateřinky (HlaMePr - 173983) <-> Na Formance (HlaMePr - 316105) | 0.86 | 706 |
| D1 12.3 km | Jažlovice (Ricany - 145530) <-> Komerční zóna Jažlovice (Ricany - 327077) | 0.8 | 711 |
| D0 61.4 km | Vinice (HlaMePr - 29963) <-> Nad Vinicí (HlaMePr - 317381) | 0.75 | 738 |
Values Differences
On average, there is a difference of approximately 10 percentage points between the normed values (ranging from 0 to 1) for the variables "vehicles detectors intensity normed value" and "All to all commuting matrix cellular network intensity". The latter variable has a lower value.
The ratio between the normed values for "vehicles detectors intensity normed value" and "All to all commuting matrix cellular network intensity" is 1.17 (0.66 divided by 0.56). However, based on the usual vehicle occupancy rate of 1.3 persons per vehicle on average, we would expect this ratio to be 1.3. The complex method used to generalize the population from the mobile network sample, see the chapter [Putting Pieces of Puzzle Together], suggests that the built-in road detectors should be considered as the ground truth, after thorough data cleaning. As a result of this analysis, some of the generalization parameters for the cellular network data need to be re-evaluated to better align with the expected reference measurements.
Rare Opposite Trends
In some days we found a disturbing opposite trend in day-to-day evaluation, i.e., one variable value increases and the other decreases. To provide judgement about these abnormalities a rigorous validation of data input quality would have to precede, see the chapter [Limitations of Study].
Discussion
Interpretation
Let's develop an idea about source data, the variable "All to all commuting matrix cellular network intensity". In the scope of the Czech Republic the variable represents in daily cycle 19.1 mil. of the cell-to-cell aggregated relations sum on 7.2 mil. of cell-to-cell relations. These were generated by 4.6 million sampled SIMs for the day, out of which 4.4 million were Czech SIMs and 0.2 million SIMs in roaming. The total distance traveled from cell to cell, Euclidean, was 147 million km. This gives an average of 31 km traveled per SIM. General information estimates are based on reference date 2021-09-01, unless otherwise stated. Shall we assume the total population of the Czech Republic is 11.4 mil., out of which 10.7 mil. of residents 19 and 0.7 million foreigners 20, then the daily distance traveled would be 147 000 000 / (4.4 sample / 11.4 population) which is 147 000 000 / 0.39, ie. 377 million km per day. The product of the result and the number of days in the year gives 138.000 million km annually. Ministry of Transportation declares "Total passenger transport performance" 111.721 million passenger-km in 2021 21.
The average distance over 202 evaluated typical weekdays for each of 30 months is 121 million km per day with an SD of 20 million km. Mass of nominal value on "region a region b relation" is 71 mil. on average, with SD 11 mil. Prague and Middle Bohemia's population accounts for 2.7 million inhabitants (Prague 1.3 mil., Middle Bohemia 1.4 mil.). 44 km per inhabitant of focused region per day.
The number of relationships between the measured nodes of the processed region of interest is approximately 20 thousand.
Estimation of the exact number of SIMs participating in the variable for the territory of interest (Prague and Middle Bohemia) can not be done directly as the resulting inter-node relations are aggregated from the beginning of processing, which makes it impossible to track individual SIMs. We do not estimate the number of population samples based on knowledge of total traveled distance, the nominal value of the variable in the territory, and the average traveled distance per user based on a closed system (Czech Republic). It is possible, but important factors influencing the calculation will need to be considered.
- Population for the variable was set based on estimates such as share of sample from the total population, losses in processing using mathematical model, etc.
- The variable represents the shortest connection by the road between nodes. We know that local residential units and their geographical centroids were used to build nodes network. It is important to understand the representation of the variable in question which is
"node A"-"neighborhood node B"-"neighborhood node N", Euclidean distance. So, it is not actually the distance one would need to drive, following the road itself.
Reduction of Data to Viewport
The big picture management and extraction of information from fine grained dataset with many of small values which is the case for the variable "All to all commuting matrix cellular network intensity" uses following techniques.
The "default view" simplifies the situation by focusing on the most important values. When dealing with data that involves all-to-all commuting, it is usually narrowed down to the second quartile. Other data is excluded, and statistics are used to monitor the extent of this simplification.
To create a new dataset, a subset is taken from the original data at a defined level, which is usually the second quartile. This subset is then further simplified to create a "bird's-eye view" of the data. Statistics are generated for this new dataset, and an appropriate level of simplification is applied to create the "bird's-eye view". See "Subsets of Dataset" 22 for detail.
Limitations of Study
A persistent problem is cleaning data before processing. Both technologies, mobile network and detectors are burdened by partial or complete outages. However, thanks to the comparison of values, it is possible to identify these problems algorithmically.
Areas for Future Research
An additional variable that can be used in the context of the project is like the census item "Residents commuting to work and school" delivered by the Czech Statistical Office. In the databases, this item is marked as "Primary Target Mobility". This item enables the detection of the sources and destinations of the routes that create the intensity on the monitored section. See "Possibility of Finding Sources and Destinations of Routes in Monitored Section" 23.
Conclusion
Let us summarize the main findings of the applied research and their significance and include a summary of developed methods and results obtained.
Comparison of an independent data sources "built into road detectors" values and "All to all commuting matrix cellular network intensity" showed correlation of 80%, with potential for improvement after data cleaning. Note that there are a large number of detectors built into the road. Four have been selected by traffic experts for the purpose of this study. Our team has not interfered with the selection in any way and had to deliver comparable data for random locations from system's perspective.
There are certain distinguishing characteristics of the project that set it apart from existing material available on the topic of "Population mobility data retrieval from cellular networks".
- The data collection and evaluation were conducted at the level of the sovereign state of the Czech Republic, using a closed economy system.
- The data used in the analysis were sourced from two major cellular networks that collectively serve over 70% of the population.
- Minimum of modelling techniques and estimates were used when processing data. We have not changed or completed datasets in any manner except of up-scale to the total population by the regions' constants estimating market share of the mobile network used.
- The time series used in the analysis comprises a dataset of 30 months' period.
- Coverage maps were available and updated monthly over the duration of the project. These maps were utilized to translate values from nodal networks created by cells of Base Transceiver Stations (BTS) to corresponding administrative units.
- The aggregation of user vectors for classification purposes was conducted in a controlled manner, adhering to previously certified methodologies, especially "Limits of the use of mobile networks in CZSO statistical surveys" 12.
Acknowledgements
We would like to thank all team members and stakeholders who helped as in the research.
Appendices
Pairing of Detectors to Achieve Comparable Base
Table: Pairing of detectors for the evaluated situation.
| Situation Code | Situation Name | Detector Number | Detector position (lat) | Detector position (lat) |
|---|---|---|---|---|
| dtr3265 | D5 23.30 km | 1633 | 49.9287 | 14.0142 |
| dtr3265 | D5 23.30 km | 1632 | 49.9287 | 14.0142 |
| dtr4041 | D1 2.76 km | 2040 | 50.01781666 | 14.52015 |
| dtr4041 | D1 2.76 km | 2001 | 50.01781666 | 14.52015 |
| dtr4045 | D1 12.3 km | 2042 | 49.96728 | 14.622442 |
| dtr4045 | D1 12.3 km | 2003 | 49.96728 | 14.622442 |
| dtr4400 | D0 61.4 km | 2210 | 50.090367 | 14.594667 |
| dtr4400 | D0 61.4 km | 2190 | 50.090367 | 14.594667 |
Overview of Processed Spatial Granularities within ROPID and IPR Projects
Table: Basic data of spatial granularities.
| Title EN | Title CS24 | Code List CZSO | Count | Area km 2 average | Inhabitant per km 2 average |
|---|---|---|---|---|---|
| State | Stát | cis0097 | 1 | 78874 | 135 |
| Regions | Kraje | cis0100 | 14 | 5634 | 301 |
| District counties | Okresy | cis0101 | 77 | 1024 | 197 |
| Governing municipalities | Správní obvody obcí s rozšířenou působností | cis0065 | 206 | 383 | 158 |
| Municipality districts | Městské části | cis0044 | 142 | 10 | 1687 |
| Municipalities | Obce a vojenské újezdy | cis0043 | 6258 | 13 | 94 |
| Basic territorial units | Základní územní jednotky | cis0051 | 6392 | 12 | 128 |
| Local residential units | Základní sídelní jednotky | cis0047 | 22598 | 4 | 851 |
Spatial Granularities of Area of Interest Represented by Geometric Centroids

Legend. Spatial granularities of the area of interest represented by geometric centroids.
Black: The administrative regions at Regions level borders. Grey: The administrative regions at Governing municipalities level borders. Names displayed for Governing municipalities.
Variables. B. Regions, C. Governing municipalities, G. Basic territorial units, H. Local residential units.
Visual representation of selected spatial granuralities from [Overview of processed spatial granularities within the ROPID and IPR projects].
Classification of BTS Based on Inter-site Distance Model

Legend. The classification of BTS based on an inter-site distance model.
Black: The administrative regions at Regions level borders, Prague and Central Bohemia Region. Grey: The administrative regions at Governing municipalities level borders.
Variables. A. Suburban, B. Rural, C. Urban, D. Dense-urban.
The figure is showing classified BTSs in focused region.
The distances of the territory covered by individual transmitters (BTS) are based on the maps of the expected spread of the mobile network signal of the T-Mobile company (the so-called dominance maps) in October 2019. The approximate distance limit is based on the distance matrix of all registered transmitters in the territory of the Czech Republic (matrix approx. 7.3 thousand * 7.3 thousand). For each transmitter, following conditions are checked. An existence of min. 3 other transmitters up to the maximum distance that assigns the type of territory and the expected size of the radius of the transmitters in the given territory. Dense-urban: 0 to 500 m. Urban: 0 to 1000 m. Suburban: 0 to 2000 m. Rural: more than 2000 m. Subsequently, the values of the range radii of the transmitters in meters are determined for individual types of territory (rounded). This classification of transmitters represents a theoretical model for determining the orientation distance that the user must overcome in order to be classified as a riding out user. The simplifying assumption of circular coverage of the territory by the transmitter can be used. The average distances (radii) for individual types of territory are as follows. Dense-urban 300 m, urban 600 m, suburban 1300 m, rural 2800 m. Transmitter distances.
When the situation is compared with nodes network created by administrative regions at the level of LRUs ("local residential units") [Spatial granularities of the area of interest represented by geometric centroids] not only the state level approximate ratio of 1 BTS to 4 LRUs can be verified by optometric, but its varying nature according to particular places is clearly visible.
Methods of Calculations
Added stationis a place where the user is expected to appear based on the knowledge of his previous, subsequent known records. The addition of stations for users in thedaily cyclealso takes into account theclassification of the userin thedaily cycle. User trips (hops) during the daily cycle have usually 48 occurrence stations for analytical purposes. If this is not the case from the point of view of the input of signaling data (general principles of operation of mobile networks), the station is added to the time window according to the following procedure, which differs for morning (00:00:00 - 04:59:59), daytime and evening ( 19:00:00 - 23:59:59) time window. Stations are added to the time window based on the knowledge of the station of occurrence in the previous and following time windows. At the beginning and end of the daily cycle, the procedure is adjusted similarly. For the morning time window, the station of residence in the daily cycle takes precedence, followed by the station of significant occurrence in the morning time window. If none of them exist, the last known station is used. Towards the beginning of the daily cycle, the first known station is used. In the case of an overlap of missing cells from the previous to the following time window, the first record in the following non-empty time window is used.Station selected by the geo methodis a place that has been selected from multiple options to ensure the principle of just one station in the `time window'. Analyzes of data from the mobile network typically contain 48 time windows during the day, i.e. time windows of 30 minutes duration. If there are multiple stations in the time window, the significant station is selected based on the time window type. In the morning time window, the station of residence or the station of significant occurrence in the morning time window has priority, in the daily time window the commuting station in the daily cycle has priority, and in the evening time window the station of residence in the daily cycle or the station of significant occurrence in the evening time window has priority. In case there is no significant station, the selection is made based on the minimization of the distance of the perpendicular connecting the cell centroid of the preceding and following station. If there are multiple identical stations after performing these operations, the first one is used, i.e. the time stamp corresponds to the first station in the time window. The selection takes place sequentially from the first to the last time window.Mathematical model of the conversion of observations in the mobile network to a territorial element or a specific territory. Mathematical model of conversion of observations in the mobile network to a territorial element or a specific territory. The model enables the conversion of totals of signaling data detected through the mobile network to totals of SIM in the administrative division of the territory. SW works in two variants, namely a) for a specific territory defined by any square polygon with a minimum size of 100 x 100 and b) for an administratively divided territory defined by the spatial element of the basic residential unit dial or the spatial element of the smart territory dial with subsequent composition into higher territorial units. The main function of the model consists in connecting the polygons of the coverage model with the polygons of an arbitrarily defined territory and their territorial elements, taking into account the continuous updating of input parameters both on the side of the mobile network and on the side of territorial elements, and last but not least, their attributes determined by statistical methods. The model works with the coverage of the following networks: FDD is UMTS; 2100 MHz; GSM is 2G; 900 and 1800 MHz; l18 is 4G LTE; 1800MHz; l21 is 4G LTE; 2100 MHz; l26 is 4G LTE; 2600 MHz; l80 is 4G LTE; 800 MHz. There may be cells in the network that are represented by a very small polygon or their coverage polygon does not contain a building object. Records from these cells are neglected when applying the model to a land feature, unless otherwise specified. See View the full model description in Czech.Unlinked trips between main stations.Unlinked trips between main stationsare a subset of theUnlinked trips between stations addedsequential relational links. They represent the sequential relational binding of locations needed to make moves between the source and destination of a journey. There and back. The first place of the first relation of a user classified asHusbandman riding outorHusbandman commuteris thestation of residence in daily cycle. The station with the longest time spent in the morning window, thestation of significant occurrence in the morning time windowwill be used for the user classified asNomad commuter. The second place of the first session is the main commuting destination. For the second session, the methodology is applied similarly. This is an expression of the relationship of the sequence of stations to the main commuting destination during the daily cycle, or for the expression of the relationship of the sequence of stations from the main commuting destination back to the station of residence (Husbandman riding out,Husbandman commuter) or stations of significant occurrence in the evening time window (Nomad Commuter). A user can have any number of trips in a given day, but these trips are usually limited by analysis rules, such as the number of time windows being watched or the number of entries allowed in one time window. A station is considered the smallest available node step of the network from the point of view of mobile network data. If there are other stations among the stations in which the user spent a minimum defined time, which do not meet the condition of time spent for more thantmin., they are added based on the assumption of the probability of making the fastest journey along the road network. The fastest route is calculated based on OSM. This is any available road connection. The statistical sign is reported in a daily cycle. The length of the user's stay at the station is not reported. Illustration of the Main Road. Note: The difference compared to theUnlinked trips between stations addedindicator is the uniqueness of the number of users reported, made possible by the method of selecting a subset.Unlinked trips between stations added. Stations for which no time definition point is available or where, according to the selected spatial granularity, the occurrence of a user is expected are added by the calculation and mathematical model. The assumption of the user's presence is made based on the knowledge of the available roads infrastructure, which the user must use to move from one station to another.Unlinked trips between stations addedrepresent a sequential relational link of places where the first place or the last place in the user'sdaily cycleis the station of residence for users classified ashusbandman. It is thus an expression of the relationship of the sequence of stations during the daily cycle. A user can have any number of trips in a given day, but these trips are usually limited by analysis rules, such as the number of time windows being watched or the number of entries allowed in one time window. In some cases, the first and/or last station in the daily cycle is not in the first or last time window, respectively.Unlinked trips between stations addedare not reported separately for the entire area of interest. They are always related to a specific line (Trips in the direction of the line,Trips in a section of the line) or a subset of the relations (Unlinked trips between main stations). In these casesUnlinked trips between stations addedinclude all the movements of users classified asHusbandman riding out,Husbandman commuterandNomad commuter.Unlinked trips between stations addedcan also be related to mapping the results ofAll to all commuting matrix cellular network intensityto a road section, e.g. to obtain information similar to thetraffic intensityindicator at a point in the transport network, which is usually measured by means of traffic detectors.
Subsets of Dataset
Table: Subsets of the dataset.
| Subset scenario | Threshold | Cumulative percentage | Cumulative sum | Cumulative count |
|---|---|---|---|---|
| A | na | 0.05 | na | na |
| A | na | 0.1 | na | na |
| A | 3 | 0.25 | 8067 | 5009 |
| A | 81 | 0.5 | 150942 | 11138 |
| A | 1208 | 0.75 | 2505597 | 16725 |
| A | 7918 | 0.9 | 13655089 | 20071 |
| A | 19382 | 0.95 | 27776423 | 21186 |
| A | 389371 | 1 | 83416497 | 22302 |
| - | - | - | - | - |
| B | 107 | 0.05 | 51810 | 556 |
| B | 143 | 0.1 | 120791 | 1110 |
| B | 322 | 0.25 | 497157 | 2792 |
| B | 1201 | 0.5 | 2338032 | 5590 |
| B | 5360 | 0.75 | 9822526 | 8386 |
| B | 19342 | 0.9 | 27568828 | 10063 |
| B | 37790 | 0.95 | 42699195 | 10622 |
| B | 389371 | 1 | 83267013 | 11182 |
| - | - | - | - | - |
| C | 5914 | 0.05 | 783518 | 139 |
| C | 6413 | 0.1 | 1646213 | 279 |
| C | 8709 | 0.25 | 4795370 | 699 |
| C | 15260 | 0.5 | 12921143 | 1398 |
| C | 30925 | 0.75 | 28078948 | 2097 |
| C | 59477 | 0.9 | 46210523 | 2517 |
| C | 84143 | 0.95 | 55972640 | 2657 |
| C | 389371 | 1 | 73449847 | 2797 |
The table comment.
Subset scenarios. A: No data subset. B: Subset scenario default view. C: Subset bird's-eye view.
Variables. Threshold: Value threshold required for inclusion in given cumulative percentage of observations.
For all-to-all commuting, the limit is typically set at the second quartile of the new dataset. After this second round of simplification, the data is of a manageable size and can be easily used with commonly accessible geo-analytical tools such as Google Maps.
Dataset for Results Validation
Download dataset for verify research results: The dataset for results validation. Download.
Table: Structure of the data set. Preview, transposed.
| jobtyp | a5e9e342-97b1-4e05-b8bd-57b23cda27e1 | a5e9e342-97b1-4e05-b8bd-57b23cda27e1 |
|---|---|---|
| region code | 3018_3026 | 3018_3026 |
| detectors case region a region b | dtr3265_lru73067_lru80799 | dtr3265_lru73067_lru80799 |
| period | 2019-10-01 | 2019-10-02 |
| all to all commuting matrix cellular network intensity nominal value | 39748 | 39254 |
| vehicles detectors intensity nominal value | 44733 | 49889 |
| all to all commuting matrix cellular network intensity zscore value | 0.49 | 0.43 |
| vehicles detectors intensity zscore value | 0.68 | 1.21 |
| all to all commuting matrix cellular network intensity normed value | 0.47 | 0.47 |
| vehicles detectors intensity normed value | 0.75 | 0.86 |
| region a region b relation code | lru73067_lru80799 | lru73067_lru80799 |
| region a region b relation euclidean distance | 1.44 | 1.44 |
| region a region b relation name | U rybníků (Beroun - 73067) <-> Levín (Beroun - 80799) | U rybníků (Beroun - 73067) <-> Levín (Beroun - 80799) |
| region a link to basic territorial unit name | Králův Dvůr (533203) | Králův Dvůr (533203) |
| region b link to basic territorial unit name | Králův Dvůr (533203) | Králův Dvůr (533203) |
| region a longitude | 14.0136734931354 | 14.0136734931354 |
| region a latitude | 49.927192400097 | 49.927192400097 |
| region b longitude | 14.0007157312906 | 14.0007157312906 |
| region b latitude | 49.9280449829482 | 49.9280449829482 |
| detectors case code | dtr3265 | dtr3265 |
| detectors case name | D5 23.30 km | D5 23.30 km |
| detector case latitude | 49.9287 | 49.9287 |
| detector case longitude | 14.0142 | 14.0142 |
| week year name | 39 | 39 |
| quarter name | 2019Q4 | 2019Q4 |
| day week name | 2-Ute | 3-Str |
| year month name | 2019_10 | 2019_10 |
| year month weekday number | 2019__10__2 | 2019__10__3 |
| year | 2019 | 2019 |
| month | 10 | 10 |
| day | 01 | 02 |
System Generated Report Traffic Intensity Proof of Concept
Download report: The report on the traffic intensity proof of concept generated by the system. Download.

Legend. The report on the traffic intensity proof of concept generated by the system.
The graphs presented in the report, excluding the graph labeled Average of All To All Commuting Matrix Cellular Network Intensity Normed Value and Average of Vehicles Detectors Intensity Normed Value by Period, use a non-standard label that may not be familiar to all readers. Instead of using a typical unit of time (such as days, weeks, or months), the x-axis of each graph represents the average value for a typical weekday in a given month, based on available data. For instance, the label "2019__10__1" indicates the average value for Mondays in October 2019. This visualization technique was recommended by the ROPID and IPR projects as it provides a more comprehensive overview of the data over time and reduces the impact of data unavailability on specific days (as described in the [Limitations of Study] section), while maintaining the accuracy of the data.
Possibility of Finding Sources and Destinations of Routes in Monitored Section

Legend. A possibility of finding sources and destinations of routes in the monitored section.
Use of the item Mobility of the main target to determine the sources and destinations of the routes on the monitored section. I Station of residence in the daily cycle. N Commuter station in the daily cycle. I-N, the attribute Rides out and commutes morning day. A-C, the attribute Monitored section. I-F-E-A-C-D-N attributes, the fastest route on the road network from the station I to the station N.
Document Accessibility
The document name: Anonymized Big Data of Mobile Operators in Services of Prague Public Transport.
The system reference identifier: b666eb08-2cc9-4b87-9585-9be05533400d.
AWS Storage Access
The content of this report was submitted for XXVIIth World Road Congress under id IP0738-Voznak-EN.
A reader of the conference paper may notice following differences to default versions available on our portal.
- The title header formatted.
- The subtitle omitted.
- Authors joined with
&. - Affiliations of authors added.
Dept. of Telecommunications
Faculty of Electrical Engineering and Computer Science
VSB – Technical University of Ostrava
17. listopadu 2172/15, 708 00 Ostrava, Czechia
miroslav.voznak@vsb.cz
ABSTRACT pseudo heading added.
- Heading REFERENCES numbering removed.
- References hypertext formatted to 10 pt.
- Appendices not included.
- Highlights not included.
-
Miroslav Vozňák, Jiří Hylmar, and Lukáš Orčík. Anonymized big data of mobile operators in services of prague public transport. In XXVIIth World Road Congress Proceedings of the Congress, index `V`. La Grande Arche - Paroi Sud - 5e étage, 92055 La Défense CEDEX - FRANCE, October 2024. PIARC WORLD ROAD ASSOCIATION. Registration to download the paper needed. Download https://proceedings-prague2023.piarc.org/ressources/files/source/4/IP0738-Voznak-EN.pdf, https://proceedings-prague2023.piarc.org/ressources/files/source/8/100849df-IP0738-POSTER.pdf. URL: https://proceedings-prague2023.piarc.org/en/documents/individual-paper-by-author?l=V. ↩
-
Use of mobile data for planning public transport. 2020. Accessed on February 28, 2023. URL: https://smlouvy.gov.cz/smlouva/13178572. ↩
-
Processing of location data of mobile operators for city planning. 2019. Accessed on February 28, 2023. URL: https://smlouvy.gov.cz/smlouva/10905012. ↩
-
System generated report traffic intensity proof of concept. February 2023. Accessed on February 28, 2023. URL: https://danse.tech/case-studies/anonymized_big_data_of_mobile_operators_in_services_of_prague_public_transport/#system-generated-report-traffic-intensity-proof-of-concept. ↩↩
-
Dataset for results validation. February 2023. Accessed on February 28, 2023. URL: https://danse.tech/case-studies/anonymized_big_data_of_mobile_operators_in_services_of_prague_public_transport/#dataset-for-results-validation. ↩
-
Danya Bachir, Ghazaleh Khodabandelou, Vincent Gauthier, Mounim El Yacoubi, and Jakob Puchinger. Inferring dynamic origin-destination flows by transport mode using mobile phone data. Transportation Research Part C: Emerging Technologies, 101:254–275, 2019. URL: https://www.sciencedirect.com/science/article/pii/S0968090X18310519, doi:https://doi.org/10.1016/j.trc.2019.02.013. ↩
-
Yixuan Pan, Qianqian Sun, Mofeng Yang, Aref Darzi, Guangchen Zhao, Aliakbar Kabiri, Chenfeng Xiong, and Lei Zhang. Residency and worker status identification based on mobile device location data. Transportation Research Part C: Emerging Technologies, 146:103956, 2023. URL: https://www.sciencedirect.com/science/article/pii/S0968090X22003692, doi:https://doi.org/10.1016/j.trc.2022.103956. ↩
-
Fereshteh Asgari, Alexis Sultan, Haoyi Xiong, Vincent Gauthier, and Mounîm A. El-Yacoubi. Ct-mapper: mapping sparse multimodal cellular trajectories using a multilayer transportation network. Computer Communications, 95:69–81, 2016. Mobile Traffic Analytics. URL: https://www.sciencedirect.com/science/article/pii/S0140366416301517, doi:https://doi.org/10.1016/j.comcom.2016.04.014. ↩
-
Anqi Wang, Anshu Zhang, Edwin H. W. Chan, Wenzhong Shi, Xiaolin Zhou, and Zhewei Liu. A review of human mobility research based on big data and its implication for smart city development. ISPRS International Journal of Geo-Information, 2021. URL: https://www.mdpi.com/2220-9964/10/1/13, doi:10.3390/ijgi10010013. ↩
-
M. Voznak and J. Hylmar. Population Mobility Data Retrieval from Cellular Networks and its Use Case in Public Transport. VSB - Technical University of Ostrava, Ostrava, 1 edition, April 2017. ISBN 978-80-248-4087-6. ↩
-
Jan Platos, Pavel Kromer, Miroslav Voznak, and Vaclav Snasel. Population data mobility retrieval at territory of czechia in pandemic covid-19 period. Concurrency and Computation: Practice and Experience, 33(23):e6105, 2021. URL: https://onlinelibrary.wiley.com/doi/abs/10.1002/cpe.6105, arXiv:https://onlinelibrary.wiley.com/doi/pdf/10.1002/cpe.6105, doi:https://doi.org/10.1002/cpe.6105. ↩
-
Limits of the use of mobile networks in czso statistical surveys. 2017. Accessed on February 28, 2023. URL: http://danse.vsb.cz/?page_id=644&lang=en. ↩↩
-
Khoa Dinh Nguyen Dang, Peppino Fazio, and Miroslav Voznak. High-speed users' mobility prediction scheme based on deep learning for small cell and femtocell networks. In Advances in Engineering Research and Application, 446–458. Springer International Publishing, 2022. ↩
-
Peppino Fazio, Miralem Mehic, and Miroslav Voznak. Effects of sampling frequency on node mobility prediction in dynamic networks: a spectral view. Digital Communications and Networks, 2022. URL: https://www.sciencedirect.com/science/article/pii/S2352864822000992, doi:https://doi.org/10.1016/j.dcan.2022.05.008. ↩
-
Classification of bts based on inter-site distance model. February 2023. Accessed on February 28, 2023. URL: https://danse.tech/case-studies/anonymized_big_data_of_mobile_operators_in_services_of_prague_public_transport/#classification-of-bts-based-on-inter-site-distance-model. ↩↩
-
Methods of calculations. February 2023. Accessed on February 28, 2023. URL: https://danse.tech/case-studies/anonymized_big_data_of_mobile_operators_in_services_of_prague_public_transport/#methods-of-calculations. ↩↩↩↩
-
Pairing of detectors to achieve comparable base. February 2023. Accessed on February 28, 2023. URL: https://danse.tech/case-studies/anonymized_big_data_of_mobile_operators_in_services_of_prague_public_transport/#pairing-of-detectors-to-achieve-comparable-base. ↩↩
-
Overview of processed spatial granularities within ropid and ipr projects. February 2023. Accessed on February 28, 2023. URL: https://danse.tech/case-studies/anonymized_big_data_of_mobile_operators_in_services_of_prague_public_transport/#overview-of-processed-spatial-granularities-within-ropid-and-ipr-projects. ↩
-
Obyvatelstvo čsú. 2 2023. Accessed on February 28, 2023. URL: https://www.czso.cz/csu/czso/obyvatelstvo_lide. ↩
-
Počet cizinců na území čr se za pět let zvýšil o třetinu, nejvíce je zde ukrajinců. 2022. Accessed on February 28, 2023. URL: https://www.ceska-justice.cz/2022/02/vnitro-pocet-cizincu-na-uzemi-cr-se-za-pet-let-zvysil-o-tretinu-nejvice-je-zde-ukrajincu/. ↩
-
Yearbook of transport of the czech republic. 2021. URL: https://www.sydos.cz/cs/rocenka_pdf/Rocenka_dopravy_2021.pdf. ↩
-
Subsets of dataset. February 2023. Accessed on February 28, 2023. URL: https://danse.tech/case-studies/anonymized_big_data_of_mobile_operators_in_services_of_prague_public_transport/#subsets-of-dataset. ↩
-
Possibility of finding sources and destinations of routes in monitored section. February 2023. Accessed on February 28, 2023. URL: https://danse.tech/case-studies/anonymized_big_data_of_mobile_operators_in_services_of_prague_public_transport/#possibility-of-finding-sources-and-destinations-of-routes-in-monitored-section. ↩
-
Územní struktura. 2 2023. Accessed on February 28, 2023. URL: https://www.czso.cz/csu/rso/uzemni_struktura. ↩